
ENERGY DATA HUB / AUSTRALIA
Public energy data.
A clearer view.
Explore the Australian energy market without piecing together dozens of source files. Prices, generation, loss factors and analysis, brought together in one place.
Free to access. No login. No paywall.
START WITH A QUESTION
Find your way into the market.
How have prices changed?
Compare historical monthly and peak prices across the five NEM regions. Download monthly or five-minute price data, and explore transmission and distribution loss factors.
Electricity data02 / GASWhat is happening in gas?
Explore historical wholesale gas prices with monthly and quarterly views, source notes and CSV downloads.
Gas data03 / GREEN ENERGYWhen is generation valuable?
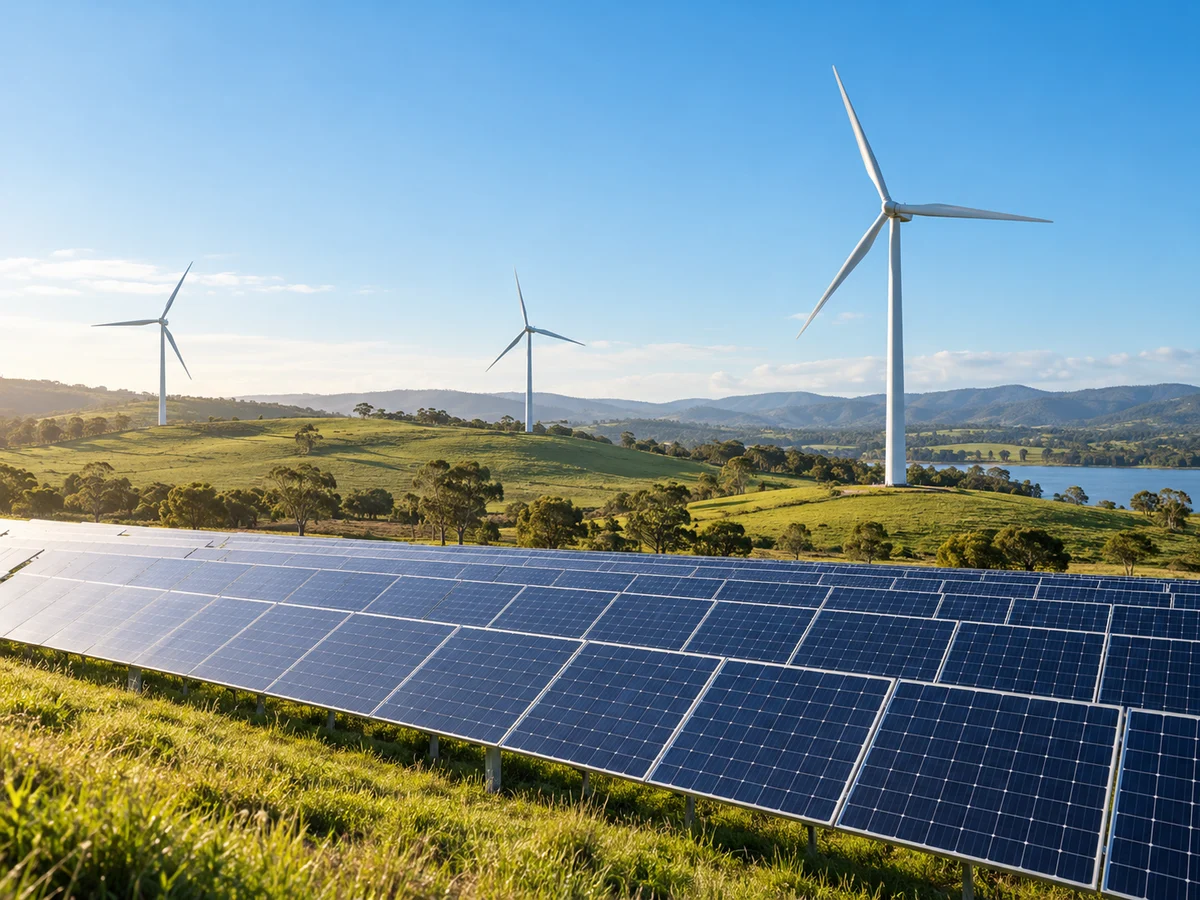
Look at renewable generation, captured prices and negative-price patterns. Compare the market context behind wind and solar output.
Green Energy04 / ENERGY LANDSCAPEWho does what?
Connect generators and gas producers with networks, markets, retailers and customers. Explore companies and generation assets by state.
Energy landscapeFEATURED INSIGHT / Q2 2026
Wind earned less,
but the market fell further.
Wind captured prices fell year on year, but less than the five-region simple-average market benchmark. Separating the market level from the generation profile changes the story.
Read the analysisAll insightsBUILT FOR PEOPLE WHO USE THE DATA
From a quick check
to your next model.
Use the charts to check a trend, download a CSV for your own analysis, or read the insights for a view on what the numbers mean.
Source links, time coverage and methodology accompany the data. Historical market averages are context: they are not a forecast, a household tariff or a project-specific valuation.